Navigate and Review Activity Dashboard in Nexaera
Ever wonder exactly what your AI agents are doing behind the scenes? The Activity Dashboard is your mission control. It logs every conversation, task, call, and background job in one place. Let me give you the full tour.
Written By Fred Yalmeh
Last updated About 2 months ago
Go to www.nexaera.com
1. Introduction
In this walkthrough, we'll explore every part of the Activity Dashboard — the summary cards, the category filters, the search, and your scheduled tasks. By the end, you'll know exactly where to look to monitor your agents.
2. Access Activity Section
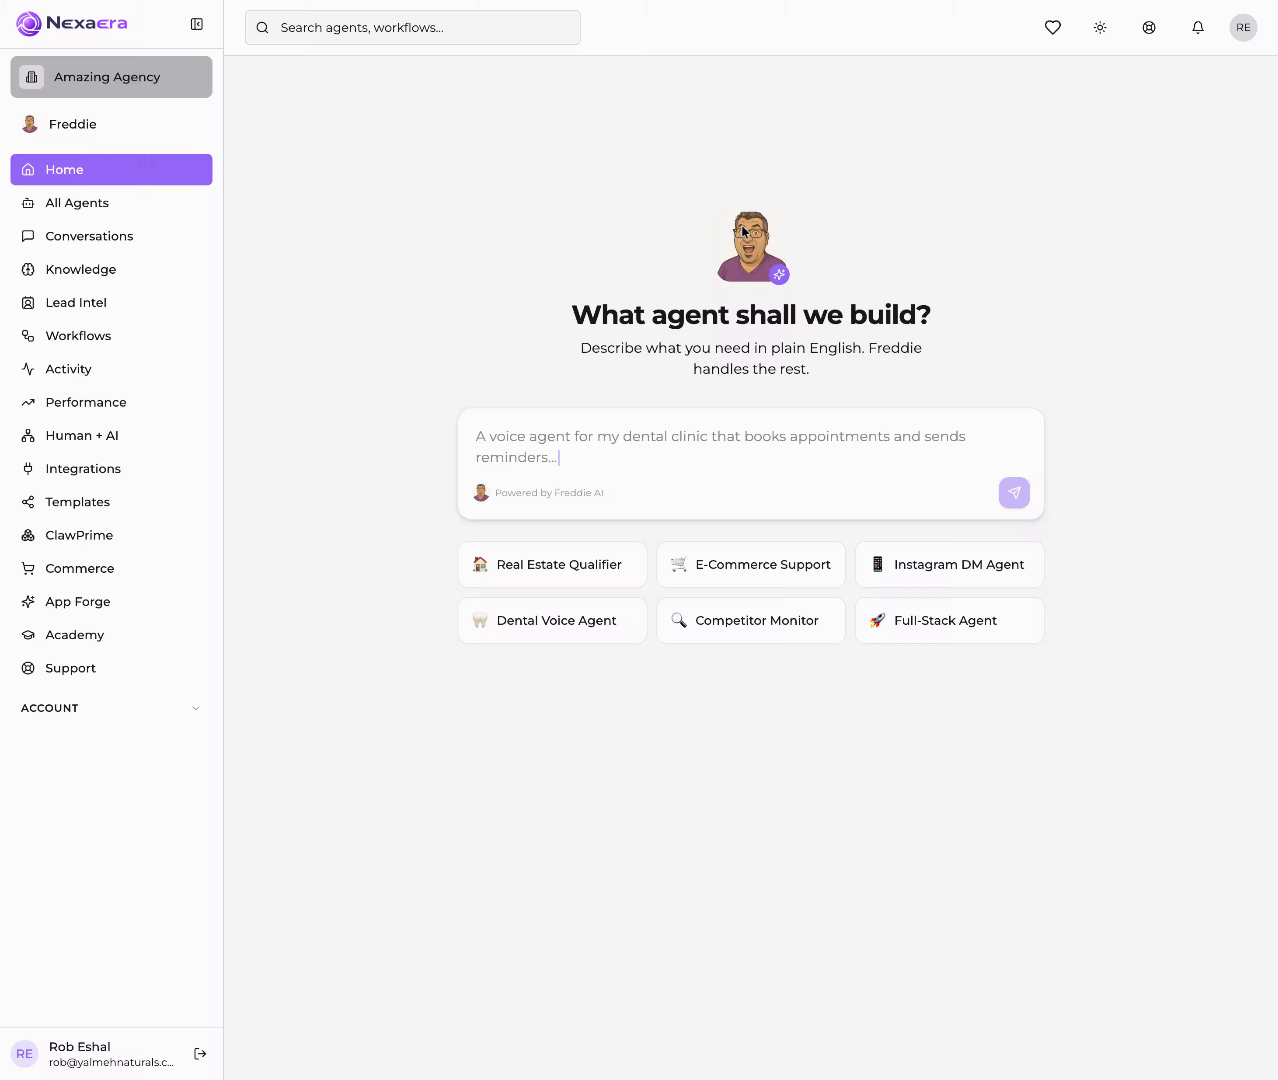
Start on the left sidebar and click "Activity." This opens the Agent Activity Center — a full history of everything your agents have done.

3. Open Conversations Tab
At the top, you'll see a row of summary cards. The first is "Conversations" — that's every chat and call your agents have handled. Right now it's zero, since this is a fresh account.

4. View Task Runs
Next to it is "Task Runs." This counts every task your agents have executed, along with their status. It's your quickest gauge of how busy your agents have been.

5. Select Browser Tasks
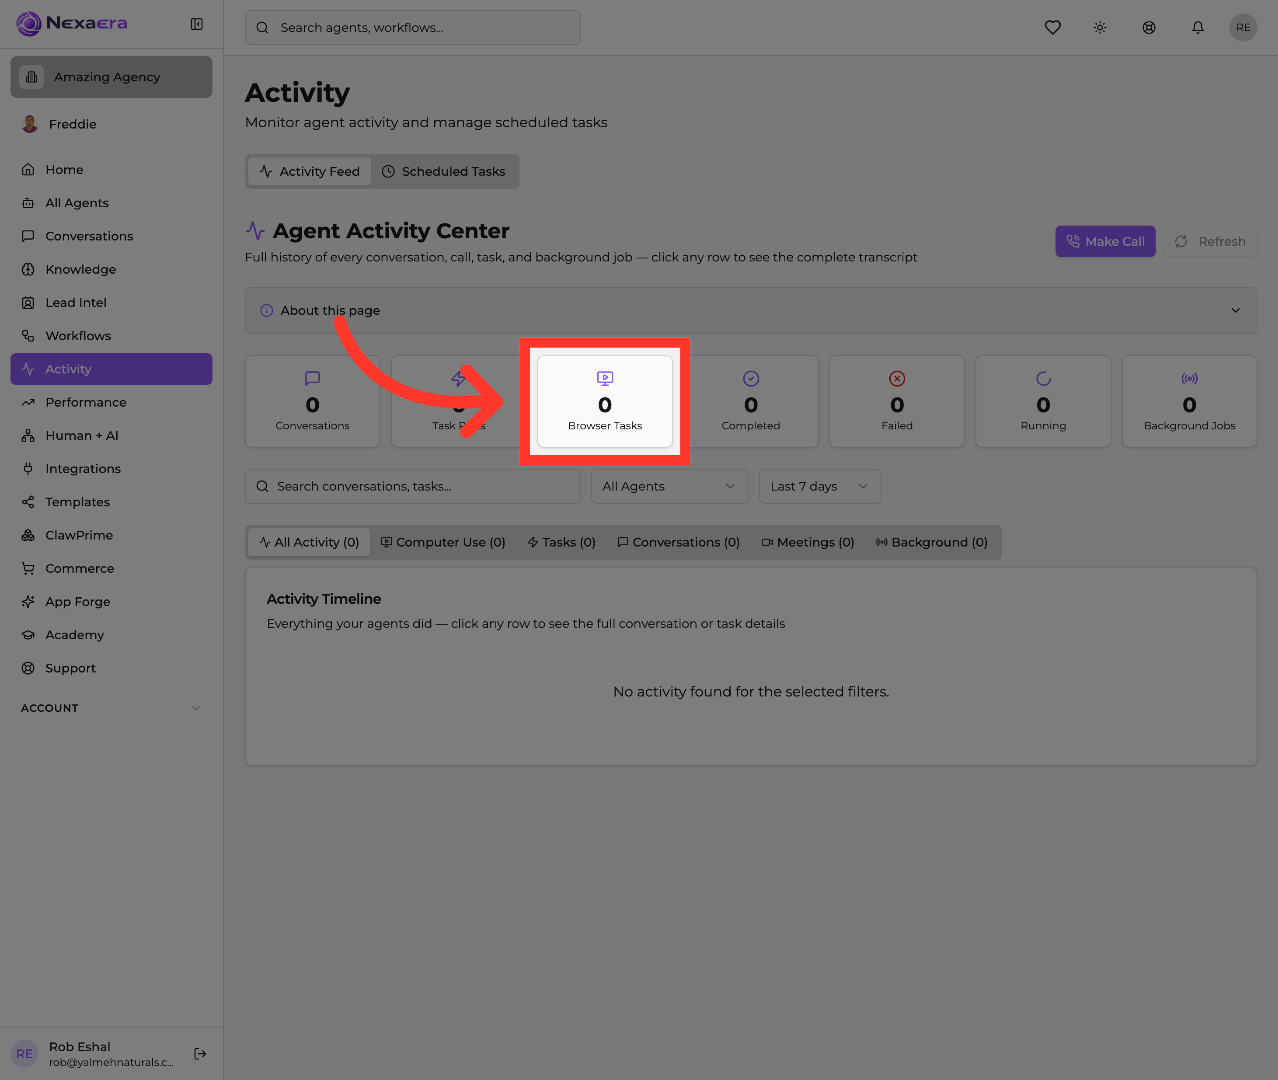
Then there's "Browser Tasks." These are jobs where an agent actually navigates the web — filling out forms, booking services, or pulling data from a site.
6. Filter Completed Tasks
The "Completed" card shows tasks that finished successfully. It's a fast way to confirm your agents are getting things done without any hiccups.

7. Select Additional Zero Count Item
Right beside it is "Failed." Any task that ran into a problem lands here. When you're troubleshooting, this is the first card to check.

8. Select Additional Zero Count Item
"Running" shows tasks that are happening right now, in real time. It's handy for watching a job as it works through its steps.

9. Open Another Zero Count Item
The last card is "Background Jobs." These are the quiet, always-on tasks — scheduled check-ins and monitors that run continuously without you lifting a finger.

10. View All Activity
Below the search bar is a row of filter tabs. "All Activity" is the default — it shows everything together in one timeline. The rest let you narrow it down by type.

11. Activate Search Field
Need something specific? Click the search bar and type a keyword. It'll dig through your conversations and tasks to find the exact activity you're after.

12. Interact with Dashboard Header
Over on the right is your date filter, set to the last seven days. Change it to zoom in on today, or look back across a longer stretch of history.

13. Open Computer Use Section
Now let's walk the filter tabs. "Computer Use" shows browser automation jobs — the agent's goals, whether they succeeded, and any data they pulled back.

14. Access Tasks Section
The "Tasks" tab lists every task your agents have run, with full step-by-step detail. It's where you go to see exactly how a job played out.

15. View Conversations Section
"Conversations" groups each complete session — a voice call or chat — into a single row. Nearby sessions from the same visitor are merged, so you can read the whole story in one place.

16. Open Meetings Section
"Meetings" collects any calls or webinars your agent has sat in on, with transcripts, summaries, and action items. To fill this in, you'll turn on the Meeting Agent skill.

17. Select Background Section
The "Background" tab tracks those always-on jobs — the scheduled heartbeats and watch tasks quietly running in the background.

18. Access Scheduled Tasks
Finally, switch to the "Scheduled Tasks" tab at the top. This is where you set up recurring jobs — daily briefings, weekly reports, or round-the-clock monitoring — on a simple schedule.

And that's the whole Activity Dashboard. You've seen the summary cards, the category filters, the search, and your scheduled tasks. Once your agents get going, this becomes the one screen you check to see everything they're doing. See you in the next one.
Still need help? Ask the team