Access And Analyze Dashboard Performance Metrics Nexaera
How do you know if your AI agents are actually pulling their weight? The Performance dashboard gives you the answer — appointments, leads, conversions, and revenue, all in one view. Let me show you around, and how to export it.
Written By Fred Yalmeh
Last updated About 2 months ago
Go to www.nexaera.com
1. Introduction
In this tour, we'll open your Performance dashboard, walk through every key metric, check the trends chart, and export the data. You'll also see how to filter by date, team, and agent. Let's dive in.

2. Access Performance Section
Start on the left sidebar and click "Performance." This opens your business KPIs — the scoreboard for your whole AI workforce.

3. Open Overview Tab
You'll land on three tabs. Click "Overview" for the big-picture summary. This is where all your headline numbers and trends live.

4. Appointments Booked
At the top is a grid of eight key metrics. The first, "Appointments Booked," counts every meeting your agents have scheduled. It's zero for now, since this is a fresh account.

5. Check Leads Captured
Next is "Leads Captured" — the number of new leads your agents have collected in the selected period. This one tells you how well they're filling your pipeline.

6. Conversion Rate
Then there's "Conversion Rate," shown as a percentage. It's the share of those leads that actually converted — a quick read on how persuasive your agents are.
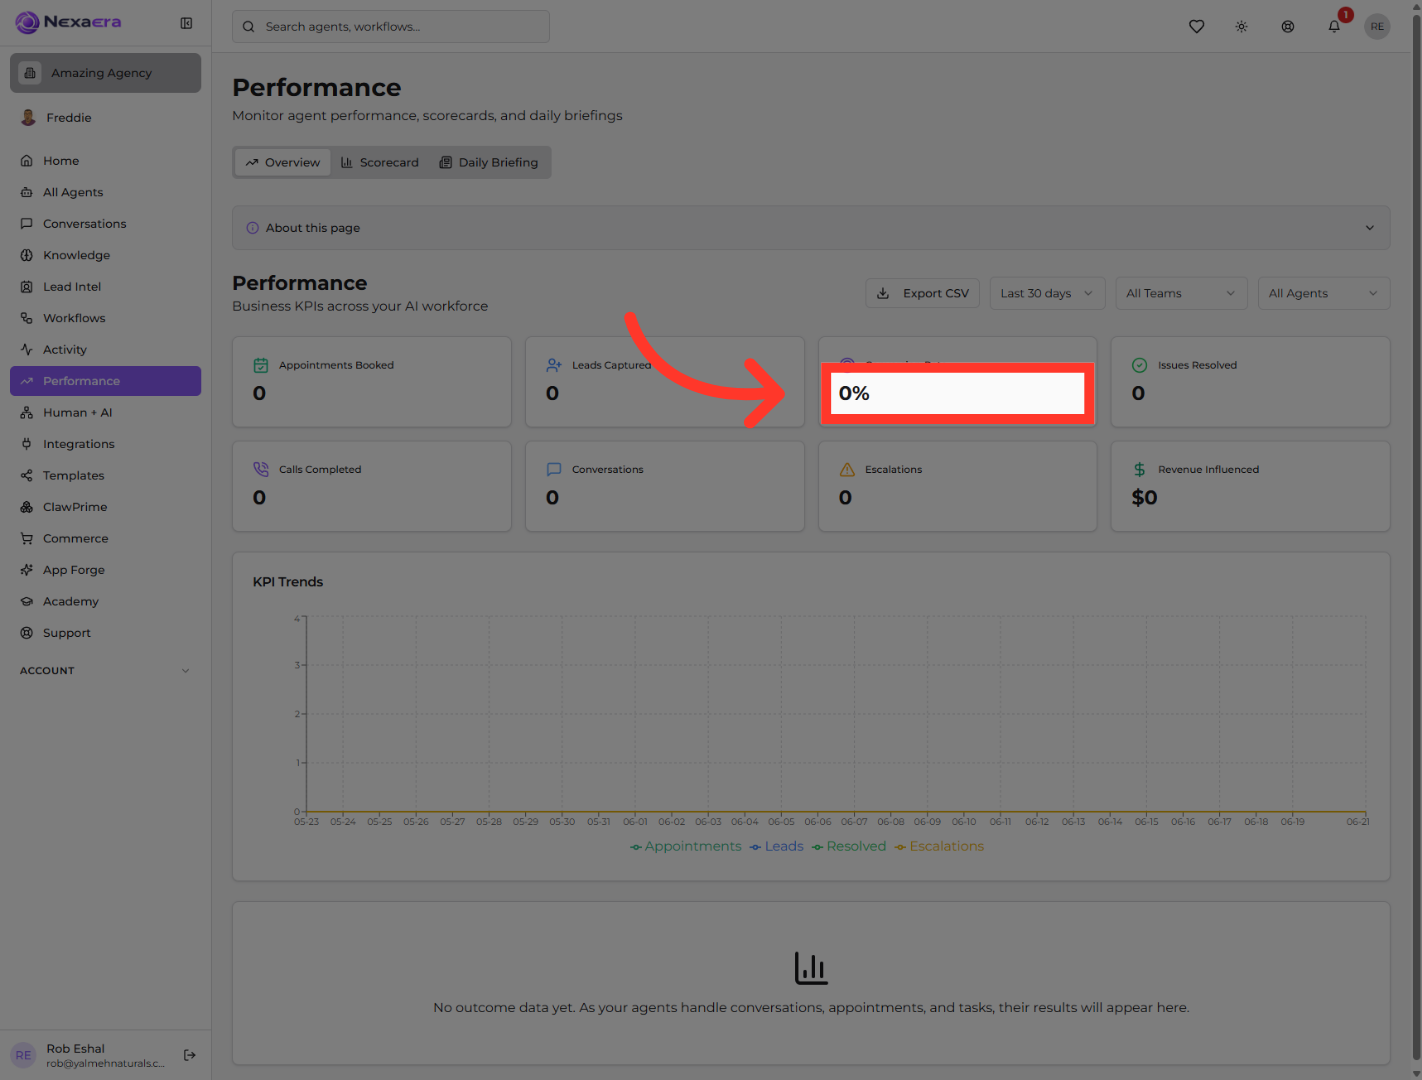
7. Issues Resolved
"Issues Resolved" counts the support problems your agents closed out on their own. The higher this is, the less that lands on your human team.

8. Review Calls Completed
"Calls Completed" is the total number of phone calls your agents finished. Handy if you've got voice agents making or taking calls.

9. Access Conversations Data
"Conversations" totals up every chat and voice session across your agents. It's your best gauge of overall activity.

10. Escalations
The last one we'll highlight is "Escalations" — the cases your agents handed off to a human. Keep an eye on this to spot where they're getting stuck.

11. KPI Trends
Below the cards is the "KPI Trends" chart. It plots your appointments, leads, resolutions, and escalations over time. Hover over any point to see the exact numbers for that day.

12. Export Data CSV
Want the raw numbers? Click "Export CSV" up top. It downloads all your performance data as a spreadsheet, ready for deeper analysis or reporting.

13. Filter by Date
Now let's talk filters. The date dropdown lets you switch between the last seven, thirty, or ninety days. Change it to zoom in on a week, or step back for the bigger picture.

14. Filter by Teams
Next to that is the "All Teams" filter. If you've split your agents into teams, use this to see just one team's numbers at a time.

15. Filter by Agent
And finally, the "All Agents" filter. Pick a single agent to see exactly how that one is performing. It's perfect for comparing your top performers.

And that's your Performance dashboard. You've seen every key metric, the trends chart, the export button, and all three filters. Once your agents get busy, this becomes your go-to scoreboard for real results. See you in the next one.
Still need help? Ask the team